WCIT Northwest Trade Dashboard

WCIT Northwest Trade Dashboard
WCIT provides its Northwest Trade Dashboard to provide a comprehensive view of the region’s international trade data – showing its impact on the economy and jobs and helping see trends develop. The dashboard covers quarterly data on:
- The volume of international trade by Congressional district
- Top exports
- Volume at all of the ports with exports*
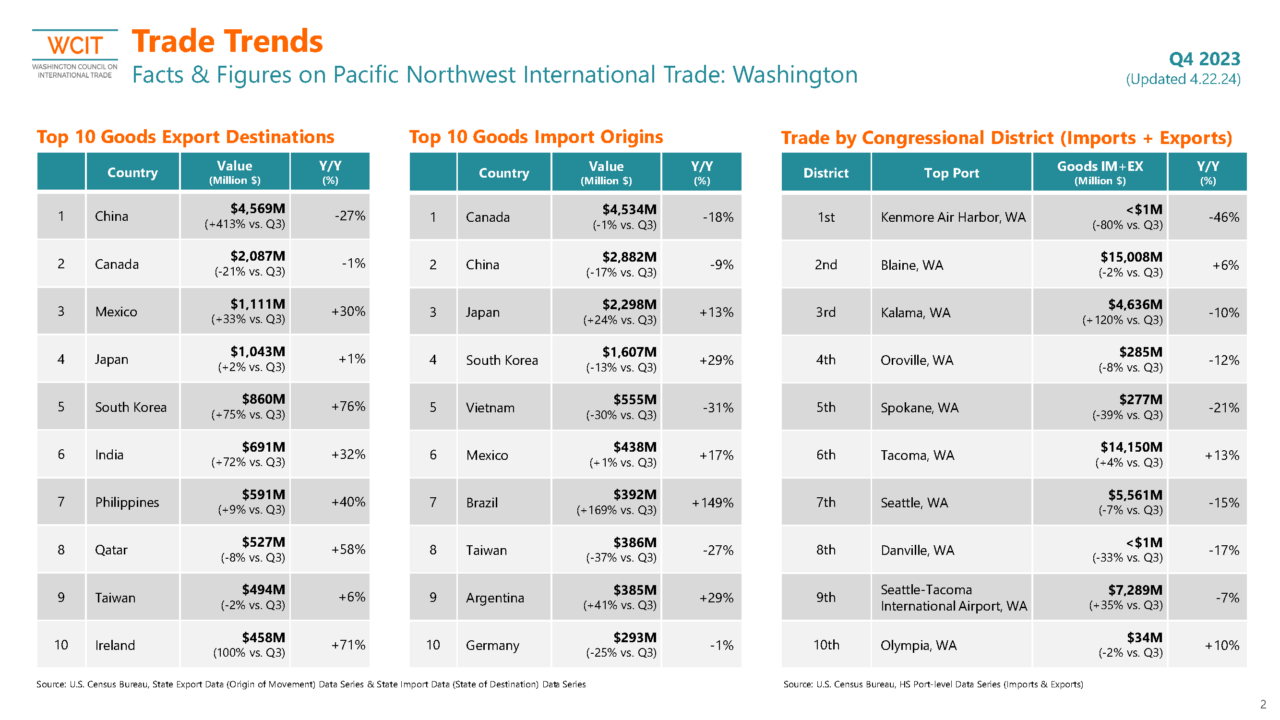
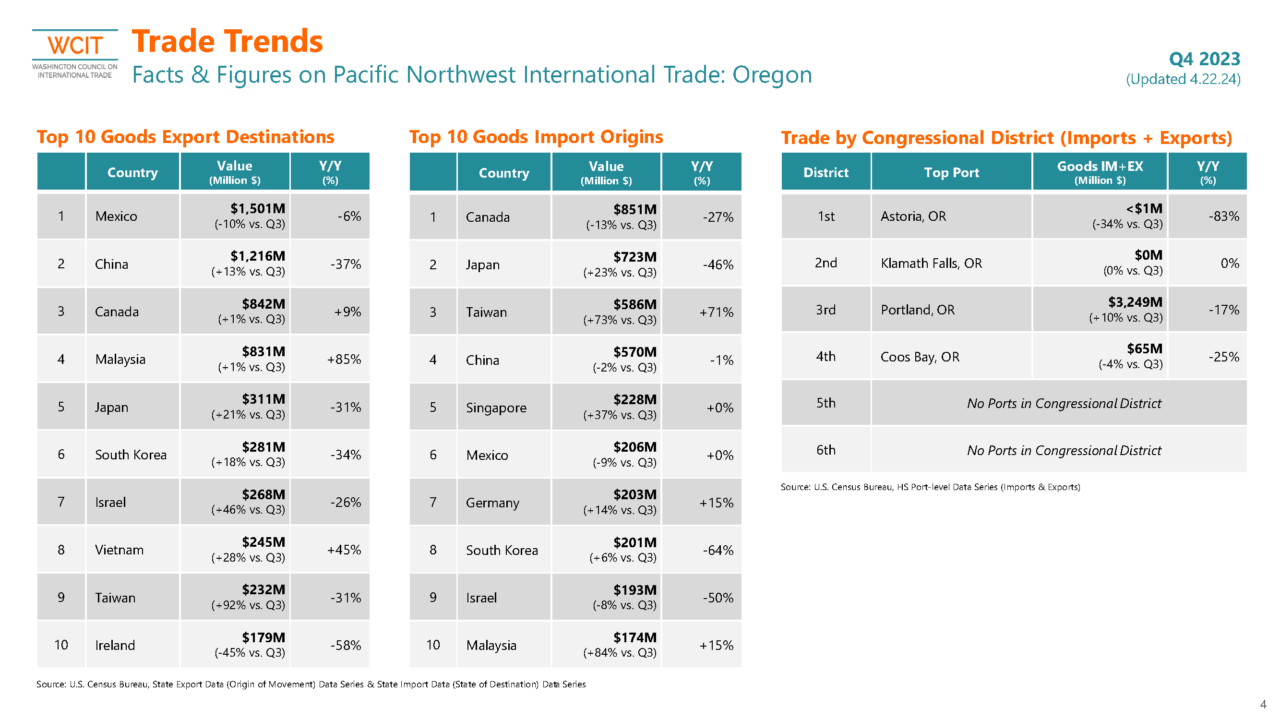
- Top countries for imports and exports
- The number of jobs related to international trade
- The total imports and exports
- And more.
This provides insights into opportunities for growth and the impact of international trade on the state’s economy.
The WCIT Northwest Trade Dashboard is a valuable resource for businesses, policymakers, and stakeholders who are interested in tracking the state’s international trade activities. Additionally, businesses and job seekers interested in the region’s trade jobs can use this data to identify thriving industries and potential areas for job growth.
The dashboard also provides information on the top countries for imports and exports to and from the Northwest. This information can help businesses to identify new markets for their products and services as well as understand the competitive landscape and help policymakers as they weigh policy proposals.
WCIT Q4 2023 Trade Dashboard
Here are some highlights from the Northwest trade data for Q4 2023.
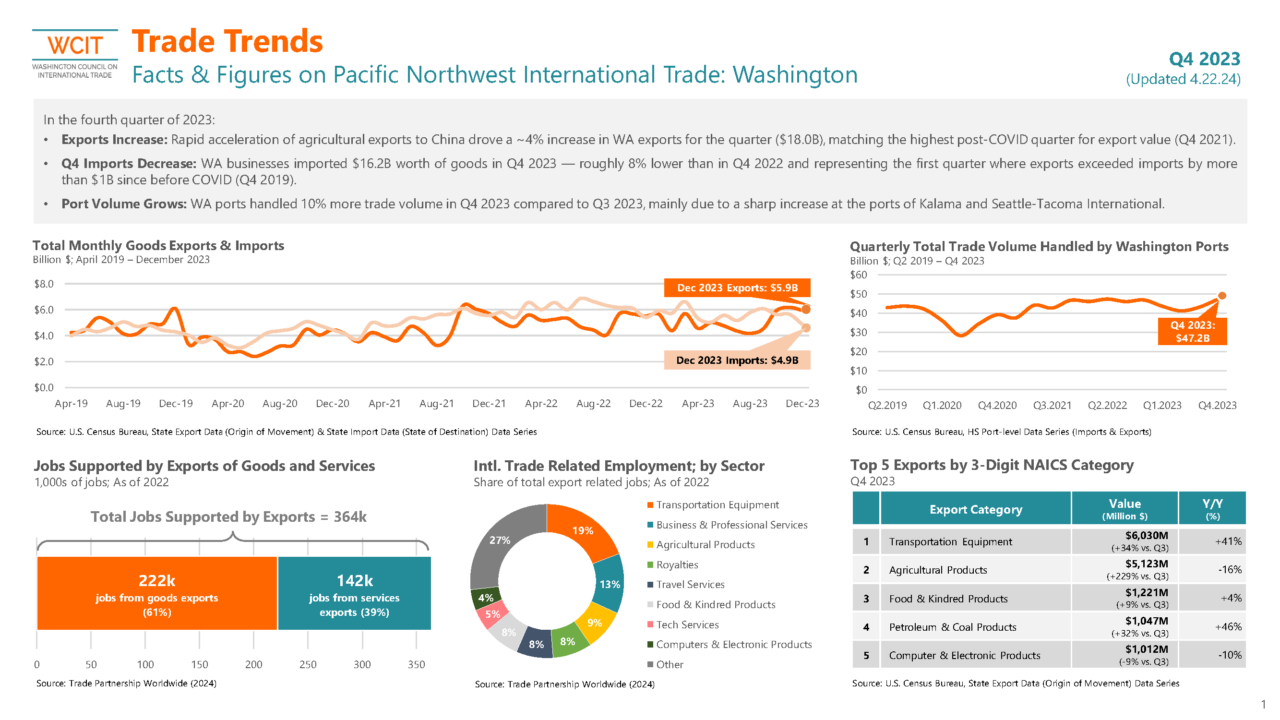
Washington
- Exports Increase: Rapid acceleration of agricultural exports to China drove a ~4% increase in WA exports for the quarter ($18.0B), matching the highest post-COVID quarter for export value (Q4 2021).
- Q4 Imports Decrease: WA businesses imported $16.2B worth of goods in Q4 2023 — roughly 8% lower than in Q4 2022 and representing the first quarter where exports exceeded imports by more than $1B since before COVID (Q4 2019).
- Port Volume Grows: WA ports handled 10% more trade volume in Q4 2023 compared to Q3 2023, mainly due to a sharp increase at the ports of Kalama and Seattle-Tacoma International.
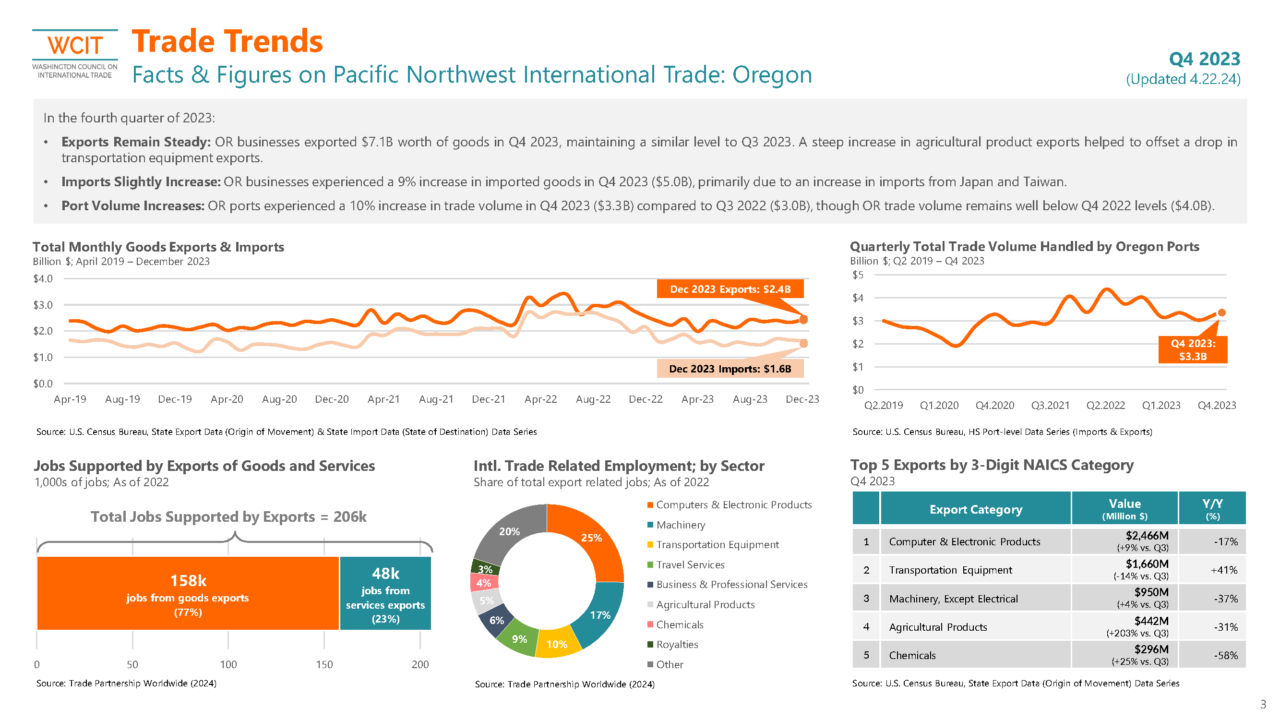
Oregon
- Exports Remain Steady: Oregon businesses exported $7.1B worth of goods in Q4 2023, maintaining a similar level to Q3 2023. A steep increase in agricultural product exports helped to offset a drop in transportation equipment exports.
- Imports Slightly Increase: OR businesses experienced a 9% increase in imported goods in Q4 2023 ($5.0B), primarily due to an increase in imports from Japan and Taiwan.
- Port Volume Increases: OR ports experienced a 10% increase in trade volume in Q4 2023 ($3.3B) compared to Q3 2022 ($3.0B), though OR trade volume remains well below Q4 2022 levels ($4.0B).
Idaho
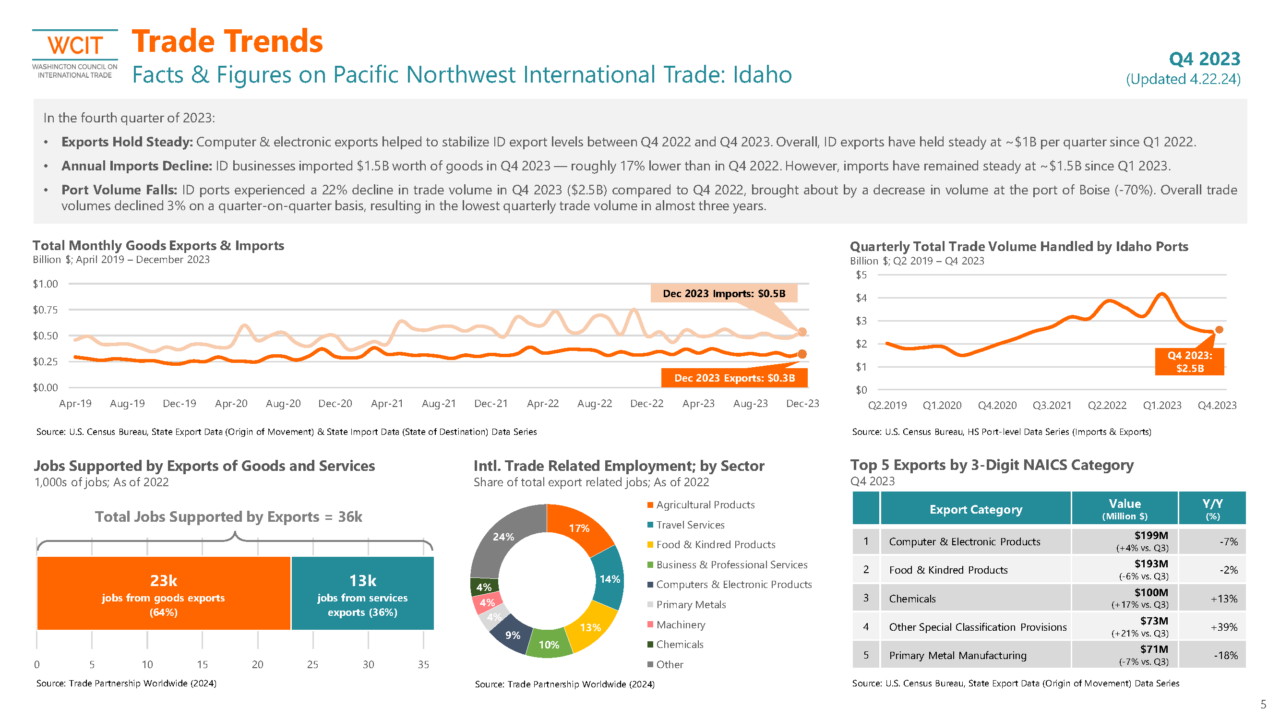
- Exports Hold Steady: Computer & electronic exports helped to stabilize ID export levels between Q4 2022 and Q4 2023. Overall, ID exports have held steady at ~$1B per quarter since Q1 2022.
- Annual Imports Decline: ID businesses imported $1.5B worth of goods in Q4 2023 — roughly 17% lower than in Q4 2022. However, imports have remained steady at ~$1.5B since Q1 2023.
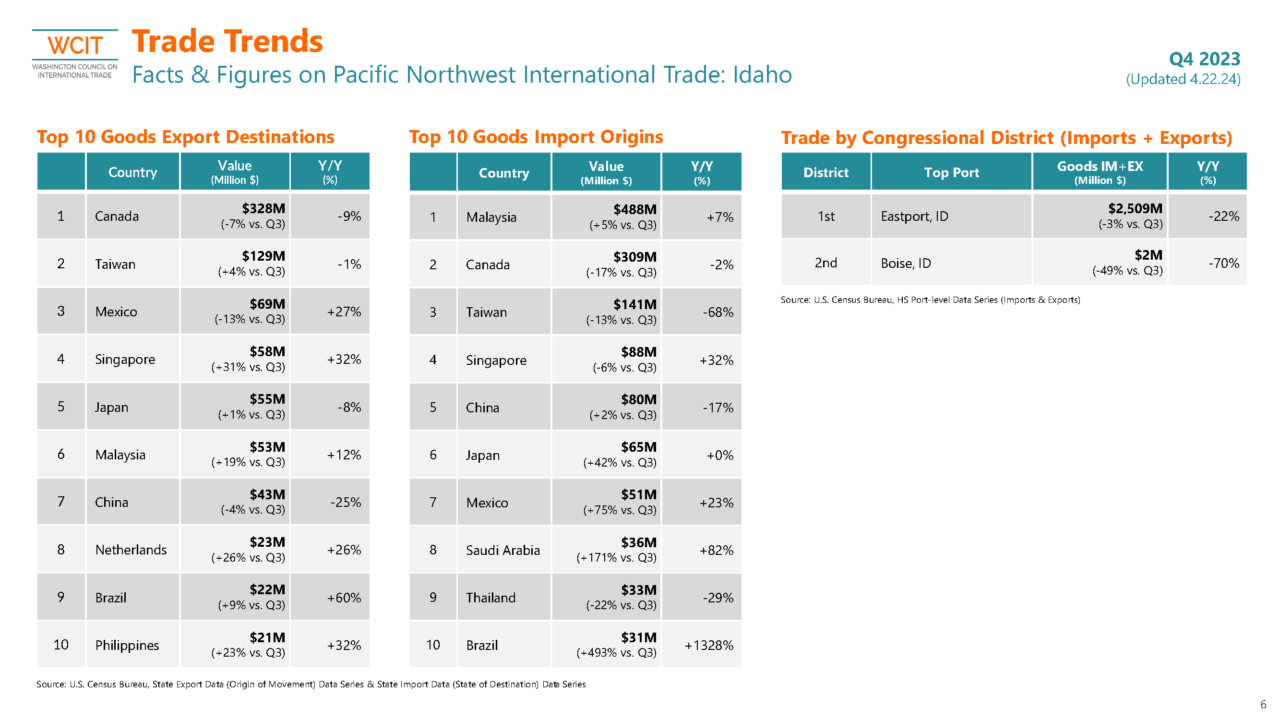
- Port Volume Falls: ID ports experienced a 22% decline in trade volume in Q4 2023 ($2.5B) compared to Q4 2022, brought about by a decrease in volume at the port of Boise (-70%). Overall trade volumes declined 3% on a quarter-on-quarter basis, resulting in the lowest quarterly trade volume in almost three years.
Some Notes on the Data
A couple of explanatory notes on the data. The Export Volume is comprised of any goods originating in, or primarily originating in that state. Port Volume is goods entering the port and leaving the port for an international port. Goods shipped to another domestic port are not credited to the origination port but to the last domestic port before a global destination.
Given that fact, digging into these numbers demonstrates how the Northwest works together to get goods to markets. For instance, in Q3 2023, Washington state ports handled roughly $13B worth of goods that were neither produced nor consumed in Washington state – much of which originated in Idaho, Oregon, and other states adjacent to the Northwest.

