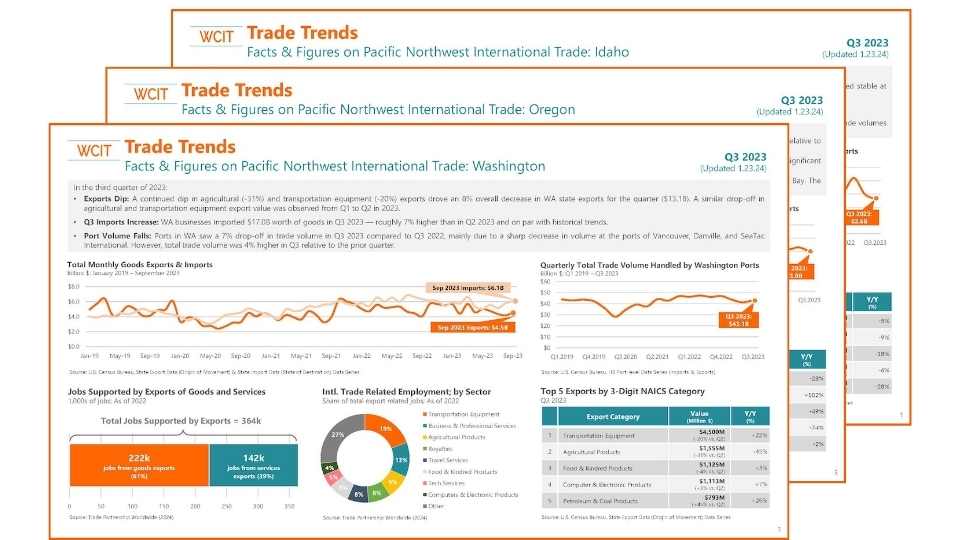
International trade is a vibrant testament to the interconnectedness of our world. Today, we are excited to announce the launch of our expanded Northwest International Trade Dashboard, which provides quarterly reporting on key trade indicators for Idaho, Oregon, and Washington. This reflects our region’s deep integration and collective strength in the global trade arena.
While each state contributes products known worldwide, from sought-after foods to technology leaders, thousands of small businesses drive innovation and fuel hundreds of thousands of jobs. Meanwhile, the regional infrastructure connects buyers and sellers to deliver products.
This expanded dashboard is a window into how these states, each with distinct economic profiles, work synergistically to contribute to a flourishing trade environment in the Northwest. We invite businesses, policymakers, and trade enthusiasts to explore the data, gain insights, and appreciate the magnitude of our region’s role in the global economy. The interconnectedness of our world is vividly reflected in the flow of goods across borders, and through this dashboard, we aim to bring that reality closer to you.
Stay tuned for further updates and insights from WCIT as we continue to champion the role of the Northwest in global trade and work for policies that expand trade opportunities for U.S. businesses and the Northwest.
The 2023 Q3 Trade Dashboard
Here are some highlights from the 2023 Q3 International Trade Dashboard.
Washington
- Exports Dip: A continued dip in agricultural (-31%) and transportation equipment (-20%) exports drove an 8% overall decrease in Washington state exports for the quarter ($13.1B). A similar drop-off in agricultural and transportation equipment export value was observed from Q1 to Q2 in 2023.
- Q3 Imports Increase: Washington state businesses imported $17.0B of goods in Q3 2023 — roughly 7% higher than in Q2 2023 and on par with historical trends.
- Port Volume Falls: Ports in Washington state saw a 7% drop-off in trade volume in Q3 2023 compared to Q3 2022, mainly due to a sharp decrease in volume at the ports of Vancouver, Danville, and SeaTac International. However, total trade volume was 4% higher in Q3 relative to the prior quarter.
Oregon
- Exports Slightly Increase: A 29% increase in computer & electronic product exports drove a 5% overall increase in Oregon exports for the quarter ($6.9B). However, Oregon exports decreased by 19% relative to Q3 2022.
- Imports Remain Steady: Oregon businesses imported $4.6B in Q3 2023, which was on par with the prior quarter. This total is roughly 42% lower than in Q3 3022, primarily due to significant decreases in the value of imports from Japan, Israel, South Korea, Singapore, and Ireland.
- Port Volume Falls: Ports in Oregon saw a 19% drop-off in trade volume in Q3 2023 compared to Q3 2022, mainly due to a sharp decrease in volume at the ports of Astoria, Portland, and Coos Bay. The drop was less steep (-9%) compared to Q2 2023.
Idaho
- Exports Hold Steady: Fairly stable levels of food & kindred products exports helped to maintain Idaho state export levels between Q2 2023 and Q3 2023. Overall, Idaho exports have remained stable at about $1B per quarter since Q1 2022.
- Q3 Imports Fall: Idaho businesses imported $1.5B of goods in Q3 2023 — roughly 21% lower than in Q3 2022. Imports to Idaho are at their lowest since Q1 2021 ($1.2B).
- Port Volume Falls: Ports in Idaho saw a 28% decline in trade volume in Q3 2023 ($2.6B) compared to Q3 2022, brought about by a decrease in volume at the port of Eastport (-7%). Overall trade volumes declined 13% compared to Q2 2023, making Q3 2023 the lowest quarterly trade volume in Idaho since Q1 2021 ($2.2B).
Some Notes on the Data
A couple of explanatory notes on the data. The Export Volume is comprised of any goods originating in, or primarily originating in that state. Port Volume is goods entering the port and leaving the port for an international port. Goods shipped to another domestic port are not credited to the origination port but to the last domestic port before a global destination.
Given that fact, digging into these numbers demonstrates how the Northwest works together to get goods to markets. For instance, in Q3 2023, Washington state ports handled roughly $13B worth of goods that were neither produced nor consumed in Washington state – much of which originated in Idaho, Oregon, and other states adjacent to the Northwest.
Receive the Latest Trade Dashboard Each Quarter
Subscribe to our trade resources mailing list to receive the latest WCIT Trade Dashboard each quarter in addition to other WCIT trade resources, news, and events. It is about one email/month for non-members.

